Is Sustainable Living Possible for Everyone?
Many people want to do better when it comes to helping save the environment. But objects or practices that some deem wasteful are necessities for others, and efforts to reduce our carbon footprint can be perceived as ableism or discrimination against those with disabilities. Plastic straw bans make environmental sense for the general population, but do they take into account people with swallowing disorders or other disabilities?
What Is Sustainability?
The definition of sustainability (PDF 3.97 MB) used by the Environmental Protection Agency (EPA) and the United Nations comes from a 1987 report by the UN Commission on the Environment and Development. Sustainability, according to the report, is “development that meets the needs of the present without compromising the ability of future generations to meet their own needs.” The report establishes three pillars for sustainability and the areas that they encompass:
Environmental
Ecosystem services, green engineering and chemistry, air quality, water quality, stressors and resource integrity.
Social
Environmental justice, human health, participation, education, resource security and sustainable communities.
Economic
Jobs, incentives, supply and demand, natural resource accounting, costs and prices.
How Does Ableism Affect People With Disabilities?
Nearly 40.7 million people in the United States live with disabilities, according to the U.S. Census Bureau, which lists six categories of disabilities: ambulatory (difficulty walking or climbing stairs), independent living (difficulty doing errands alone), cognitive (difficulty remembering, concentrating or making decisions), self-care (difficulty bathing or getting dressed), hearing and vision.
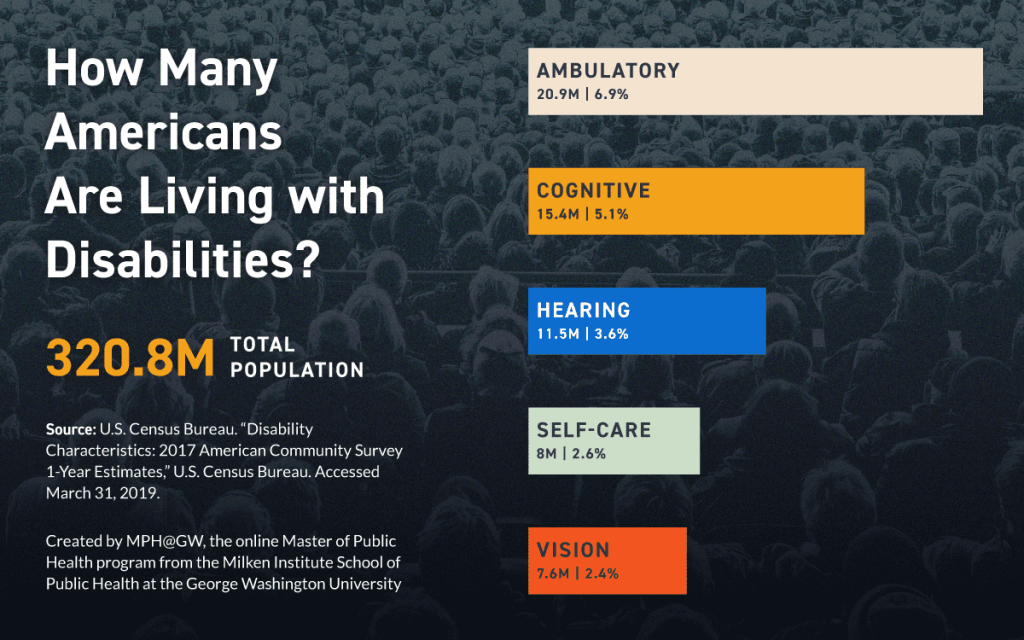
Approximately 2.4% of the population live with vision disabilities, which amounts to more than seven million people.
Go to tabular data to learn more about the number and percent of Americans living with disabilities.
Dr. George Gray, professor in the Department of Environmental and Occupational Health at the Milken Institute School of Public Health at the George Washington University, said he teaches his students to “understand that making good policy means that you also have to think about how you use underlying science and that’s through some kind of analysis.”
But making policy can be complicated, especially at the local level. Gray, who co-teaches a course called Environmental and Occupational Health in a Sustainable World, said when it comes to sustainability and the debate over plastic straws, reasons why someone might require them need to be weighed.
“Most people will see very little cost, but people who are disabled and require some kind of assistance in the way in which they drink, are going to feel the effects of this much more than others,” he said. “Making those kinds of decisions is really about a democratic and a social process of working through our values and the distribution of the cost and the benefits.”
As reported in an article in Globalization and Health, assistive products, such as wheelchairs, artificial limbs, eyeglasses, hearing aids and convenient pill organizers, enable people to live healthy, productive and independent lives, and to participate in education, the workforce and communities. In some cases, assistive products include non-sustainable items such as disposable wipes, incontinence products and plastic bags that are harmful to the environment.
While plastic has the potential to be detrimental to the oceans, it’s important to consider other offenders when it comes to products that make their way into our rivers, lakes and oceans.
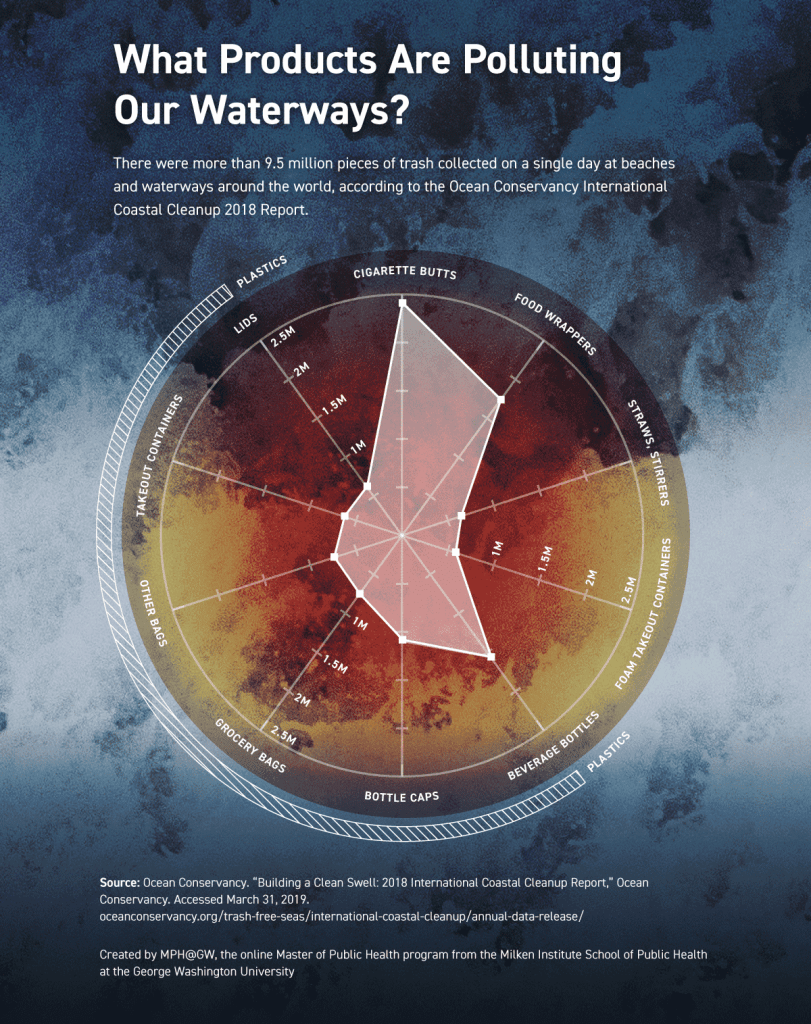
Plastics made up the largest number of trash collected on a single day, with more than six million pieces combined of plastic bottles, caps, lids, bags and takeout containers.
Without plastic straws, people living with Duchenne muscular dystrophy or cerebral palsy might not be able to drink. Without disposable briefs, people living with multiple sclerosis might not want to leave their homes or interact with others. There might be situations in which caregivers and health care professionals need non-sustainable products, such as disposable gloves to deliver injections or disposable wipes to maintain good hygiene.
And it’s not just people with disabilities or their caregivers who use products that may be perceived as harmful to the environment. Food service workers and those coming into contact with biohazardous products use these products and plastic gloves and aprons as well.
Rules and regulations may lead to unintended results. For instance, while bans on plastic shopping bags have reduced plastic trash, people who once repurposed those shopping bags instead bought their own plastic bags. A 2019 study published in the Journal of Environmental Economics and Management about the effect of disposable shopping bag regulations in California from 2011 to 2015 found that an annual 40 million-pound reduction in plastic bag waste resulted in sales of heavier plastic bags.
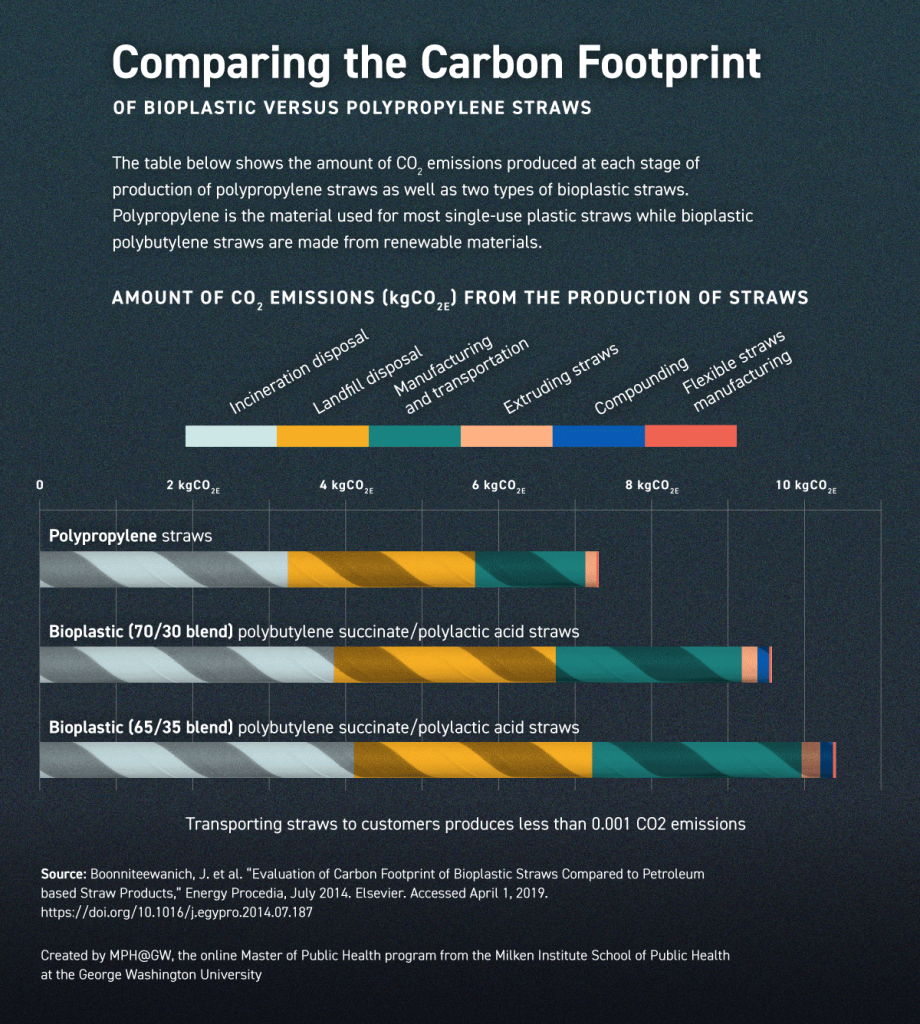
A 2014 study summarized and compared the production and disposal effects of bioplastic — made from agricultural by-products or other containers using microorganisms — versus polypropylene straws. The study found that the carbon footprint for bioplastic straws was higher than traditional polypropylene straws because of the waste produced in manufacturing.
Ableism might be unintentional, but people with disabilities that require them to use plastic straws to drink are affected by laws banning the products. Paper straws, which have been suggested as an eco-friendly alternative, are often too flimsy and can disintegrate.
Disability advocates say people with disabilities who need access to plastic straws aren’t against sustainability.
“I’d be more than happy to use more environmentally friendly straws,” Daniel Gilbert, a 25-year-old from Kentucky who has weakened muscles from Duchenne muscular dystrophy, told CNN. “[The disabled community] isn’t trying to be anti-environment. We’re just protecting disabled people.”
Good Policy Comes From Analysis
Taking the time to analyze and discuss issues such as sustainability could yield alternative activities for reducing our carbon footprint, according to Gray.
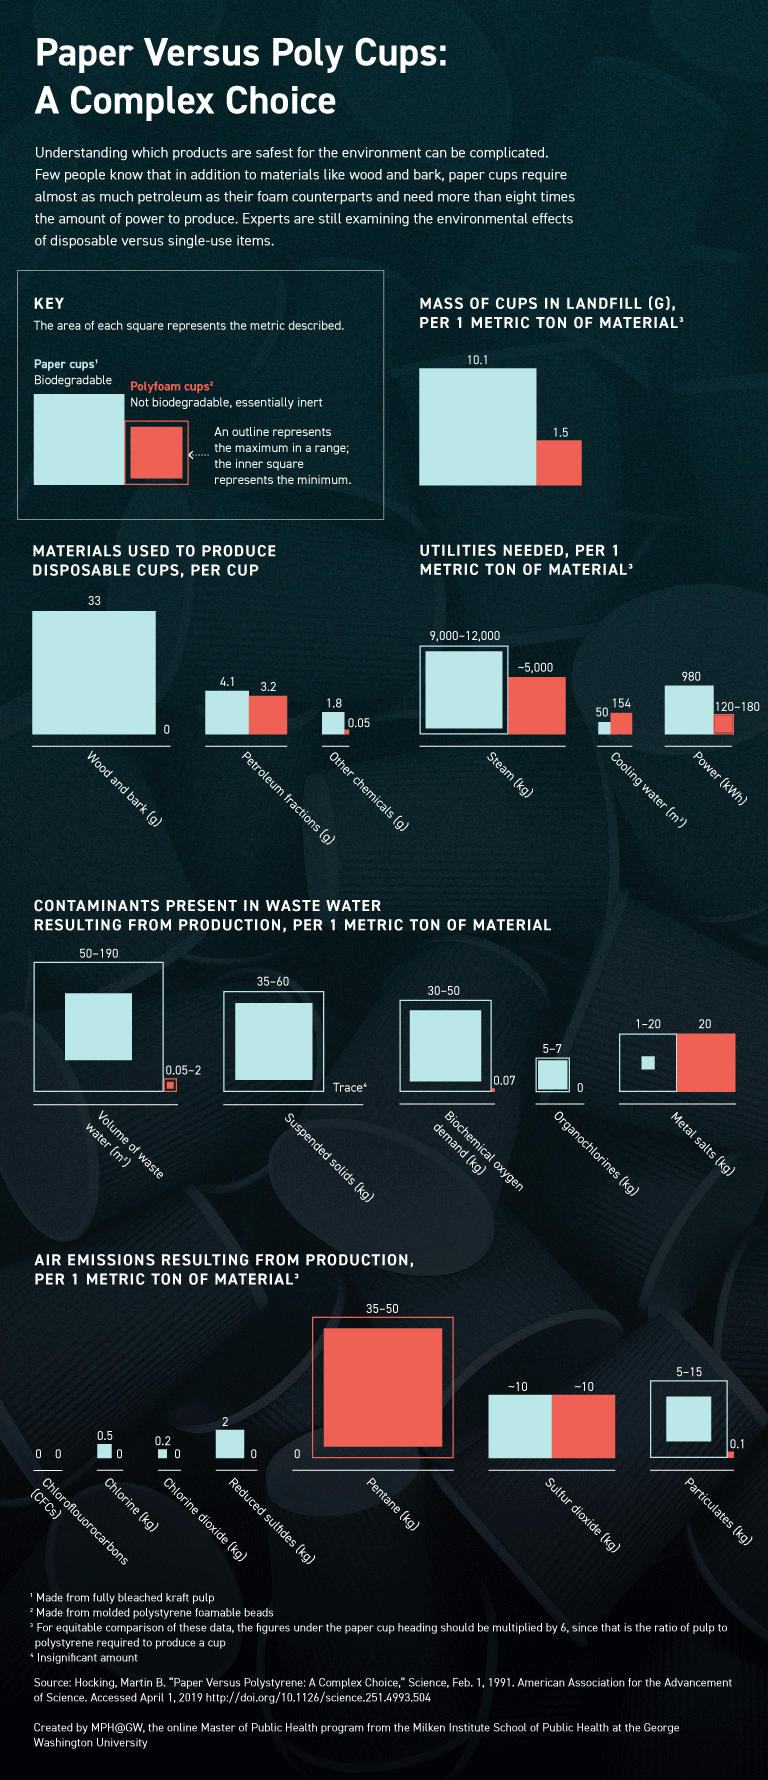
It could also debunk some conventional wisdom: One notable study published in Science by Martin B. Hocking in 1991 (PDF, 551KB) is often cited as showing that the amount of energy required to produce a paper cup makes its carbon footprint larger than a foam cup.
Hocking went as far as to say that foam cups “should be given a much more even-handed assessment as regards to their environmental impact.”
The results from Hocking’s study show the raw materials, utilities and environmental impact of cups made of paper compared to those made of polyfoam.
“Students are often surprised to find out that from a total life cycle perspective, for example, Styrofoam cups are potentially better for the environment than a paper cup,” Gray said. “And that’s simply because of all of the various things that go into the production of those cups from the raw materials all the way to the way in which they are disposed.”
Finding a middle ground between improving behavior toward the environment while making room for the needs of the disabled community has to be done with consideration. When it comes to making policy and laws, every member of the community should have a say, according to Gray.
“You need to have input from the public and especially the affected public,” he said. “The science and the analysis can tell you what might happen, but the straws is a situation where the cost and the benefits of a ban don’t fall evenly on everyone.”
Resources to Learn More:
- “The Complex Path to Sustainability,” Olivia Tyler, Ted Institute video
- “Good Life Goals,” World Business Council for Sustainable Development
- “Green Eco Tips for Sustainable Living,” Global Stewards
- “Our Planet Is on the Brink. Here’s How We Save It,” World Economic Forum
- “Protecting Our Planet Starts With You,” National Oceanic and Atmospheric Administration
- “Realistic Ways You Can Combat Climate Change, Today,” MPH@GW, the online Master of Public Health program at the George Washington University
- “Reduce, Reuse, Recycle,” Environmental Protection Agency
- “Sustainable Lifestyle,” Centers for Disease Control and Prevention
- “Sustainable Management of Food,” Environmental Protection Agency
- “Why We Need to Think Differently About Sustainability,” Leyla Acaroglu, TedX Talks video
Websites:
The following section contains tabular data from the graphics in this post.
How Many Americans Are Living with Disabilities?arrow_upward
| Disability | Population Living with This Disability, in Millions | Percent Living with This Disability |
|---|---|---|
Ambulatory | 20.9 | 6.9 |
Cognitive | 15.4 | 5.1 |
Self-care | 8.0 | 2.6 |
Hearing | 11.5 | 3.6 |
Vision | 7.6 | 2.4 |
What Products Are Polluting Our Waterways? arrow_upward
| Trash | Number of Pieces Collected |
|---|---|
Cigarette butts | 2,412,151 |
Wrappers | 1,739,743 |
Plastic beverage bottles | 1,569,135 |
Plastic bottle caps | 1,091,107 |
Plastic grocery bags | 757,523 |
Other plastic bags | 746,211 |
Straws, stirrers | 643,562 |
Plastic takeout containers | 632,874 |
Plastic lids | 624,878 |
Plastic takeout containers | 580,570 |
Total | 10,797,754 |
Comparing the Carbon Footprint of Bioplastic Versus Polypropylene Straws arrow_upward
| Stage of Production | Polypropylene Straws | Bioplastic (65/35 blend) Straws | Bioplastic (70/30 blend) Straws |
|---|---|---|---|
Manufacturing and transportation | 1.439 | 2.735 | 2.43 |
Compounding | – | 0.166 | 0.154 |
Extruding straws | 0.148 | 0.247 | 0.207 |
Flexible straws manufacturing | 0.025 | 0.033 | 0.033 |
Transporting straws to customer | 0.001 | 0.001 | 0.001 |
Incineration disposal | 3.245 | 4.11 | 3.848 |
Landfill disposal | 2.449 | 3.115 | 2.9 |
Total (From the Above Processes) | 7.309 | 10.409 | 9.575 |
Raw Materials, Utilities, and Water and Air Emissions from Disposable Cup Productionarrow_upward
Paper cups1: Biodegradable
Polyfoam cups2: Not biodegradable, essentially inert
Mass of cups in landfill (g), per 1 metric ton of material3
Paper cups: 10.1
Polyfoam cups: 1.5
Materials Used to Produce Disposable Cups, Per Cup
| Raw Materials | Paper Cup1 | Polyfoam Cup2 |
|---|---|---|
Wood and bark (g) | 33 | 0 |
Petroleum fractions (g) | 4.1 | 3.2 |
Other chemicals (g) | 1.8 | 0.05 |
Utilities Needed, Per 1 Metric Ton of Material3
| Utilities | Paper Cups | Polyfoam Cup |
|---|---|---|
Steam (kg) | 9,000 to 12,000 | ~5,000 |
Power (kWh) | 980 | 120 to 180 |
Cooling water (m3) | 50 | 154 |
Contaminants Present in Waste Water Resulting from Production, Per 1 Metric Ton of Material
Volume of waste water (m3)
Paper cups: 50 to 190
Polyfoam: 0.5 to 2
| Contaminants | Paper Cups | Polyfoam Cups |
|---|---|---|
Suspended solids (kg) | 35 to 60 | Trace4 |
Biochemical oxygen demand (kg) | 30 to 50 | 0.07 |
Organochlorines (kg) | 5 to 7 | 0 |
Metal salts (kg) | 1 to 20 | 20 |
Emissions Resulting from Production, Per 1 Metric Ton of Material3
| Air emissions | Paper Cups | Polyfoam Cups |
|---|---|---|
Chlorine (kg) | 0.5 | 0 |
Chlorine dioxide (kg) | 0.2 | 0 |
Reduced sulfides (kg) | 2.0 | 0 |
Particulates | 5 to 15 | 0.1 |
Chloroflouorocarbons (CFCs) | 0 | 0 |
Pentane (kg) | 0 | 35 to 50 |
Sulfur dioxide (kg) | ~10 | ~10 |
1 Made from fully bleached kraft pulp
2 Made from molded polystyrene foamable beads
3 For equitable comparison of these data, the figures under the paper cup heading should be multiplied by 6, since that is the ratio of pulp to polystyrene required to produce a cup
4 Insignificant amount
Citation for this content: MPH@GW, the online MPH program from the Milken Institute School of Public Health at the George Washington University.