


The Truth Behind Latino Health Disparities
Significant health disparities exist within the Latino population, which is why the George Washington University School of Public Health and Health Services has launched the Avance Center for the Advancement of Immigrant/Refugee Health. This effort is in collaboration with the Maryland Multicultural Youth Centers, the Rivera Group and other partners with the goal of working with a Latino population in Maryland to better understand health disparities specific to this and other immigrant communities.

Experts associated with the new center have worked to identify the types of disparities that affect Latinos, including obesity, diabetes, substance abuse, violence and HIV/AIDS. Their research is also supported by the “CDC Health Disparities and Inequalities Report – United States, 2011,” which also identifies a variety of contributing factors identified among Latinos, such as less education, higher rates of poverty, unhealthy living conditions and environmental hazards.
According to a 2012 report of the Roundtable on the Promotion of Health Equity and the Elimination of Health Disparities, health disparities between Latinos and other populations have not improved over the last decade. In addition, a 2010 report of a study entitled, “Trends in U.S. Public Awareness of Racial and Ethnic Health Disparities (1999-2010),” indicated a trend of negative awareness, with less than two-thirds of Americans aware that racial and ethnic health disparities exist.
Contributing Factors
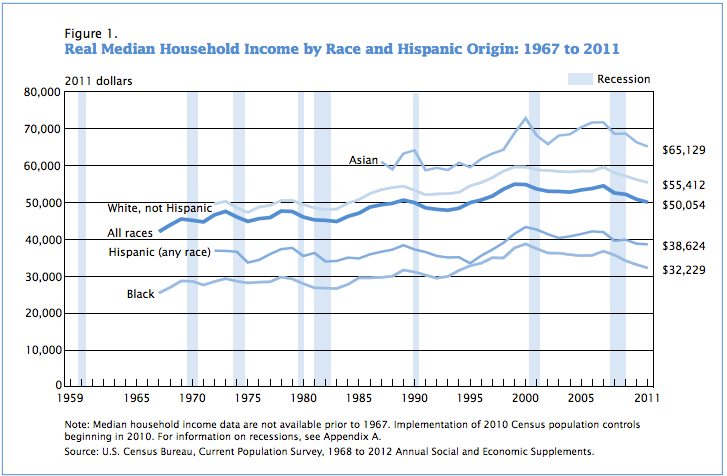
-
All Races
Year Median Income 201150,054201050,838200952,186200852,554200754,497200653,776200553,359200452,794200352,978200253,024200153,650200054,845199954,958199853,630199751,728199650,685199549,980199448,463199347,906199248,140199148,539199049,999198950,648198849,760198749,381198648,769198547,102198446,237198344,874198245,160198145,281198046,046197947,591197847,682197745,905197645,617197544,872197446,079197347,586197246,644197144,728197045,168196945,521196843,888196742,076White, Not Hispanic
Year Median Income 201155,412201056,187200957,097200858,015200759,582200658,486200558,494200458,244200358,432200258,639200158,830200059,590199959,632199858,532199756,721199655,391199554,530199452,762199352,402199252,310199152,079199053,342198954,422198854,054198753,459198652,438198550,791198449,7911983NA198248,071198148,533198049,438197950,601197850,502197749,231197648,759197547,279197448,601197350,311197249,631Black
Year Median Income 201132,229201033,142200934,161200835,749200736,795200635,666200535,543200435,838200336,256200236,291200137,442200038,749199937,691199834,964199735,017199633,534199532,844199431,584199329,953199229,471199130,302199031,186198931,684198829,988198729,696198629,539198529,553198427,788198326,705198226,794198126,847198027,986197929,296197829,789197728,486197628,414197528,170197428,659197329,357197228,562197127,635197028,634196928,715196826,947196725,476Asians
Year Median Income 201165,129201066,296200968,638200868,575200771,714200671,667200570,370200468,478200368,120200265,799200168,143200072,827199968,819199864,321199763,252199661,802199559,570199460,807199358,803199259,399199158,727199064,205198963,256198858,976198761,062Hispanic (Any Race)
Year Median Income 201138,624201038,824200939,881200839,610200741,962200642,151200541,428200440,811200340,355200241,389200142,644200043,323199941,522199839,073199737,222199635,567199533,530199435,180199335,095199235,508199136,560199037,287198938,409198837,211198736,638198635,949198534,831198435,051198334,176198233,981198136,322198035,492197937,706197837,360197736,012197634,408197533,711197436,651197336,866197236,927
Source: http://www.census.gov/prod/2012pubs/p60-243.pdf
There are a variety of factors that contribute to Latino health disparities, including the disproportionate number of Latinos who live below the U.S. poverty line. Those living in poverty commonly suffer with lower access to medical care, prescription drugs and health insurance, resulting in less preventative care and higher rates of potentially preventable hospitalizations. The U.S. Census Bureau reported that 30.1 percent of Hispanics were uninsured in 2011.
Culture also plays a role. According to the Huffington Post and NBC Latino, Hispanics are less likely to see a doctor than other groups, perhaps due to an unrealistically positive perception of health. Dr. Jane Delgado, president and CEO of the National Health Alliance for Hispanics says, “We don’t go to the doctor until we’re very, very sick. By then, our health care clinician is limited in what they can do because the condition is too difficult to pinpoint.”
Despite these findings, most Hispanics outlive non-Hispanics, according to the National Center for Health Statistics. Unfortunately, this longevity is often accompanied by chronic conditions that contribute to poor quality of life, progressive severity of illness and increased health care costs.
Improvement Efforts
Many efforts are underway to improve this situation. In a first-time report, “CDC Health Disparities and Inequalities Report – United States, 2011,” the CDC identified minority groups and target populations which have specific needs. The CDC plans to increase efforts to eliminate such disparities through surveillance, analysis and reporting as well as identification and application of proven strategies to achieve increased health equality.
In addition, the George Washington University School of Public Health and Health Services has made a commitment to decrease Latino health disparities by launching the Avance Center for the Advancement of Immigrant/Refugee Health. The Avance Center will be made up of four core areas: administrative, research, training, and education and community outreach.
As part of the research core, the “Adelante” program will be started in Langley Park, Maryland, home to many Latino immigrants and Central American refugees. A variety of programs and activities will be offered to enhance leadership development, advocacy, education, fitness and youth engagement. Programs geared toward reduction of risky behavior will also be available, as well as counseling and case-management services for high-risk youth and struggling families.
GW students will have opportunities to interact with local communities through the Avance Center’s training and education core. Community engagement will be enhanced within the outreach core through mobile and social media efforts.
A five-year research grant from the National Institute on Minority Health and Health Disparities is providing funding for the project.
The Avance Center welcomes community engagement in support of its mission to help create new solutions to decrease Latino health disparities and improve health equality